Blog By SEBI Registered Research Analyst Shubham Rajendra Jain, Registration Number INH000013554 . Date 28-12-2023
How to trade range Breakouts and manage risk while taking positional trades.
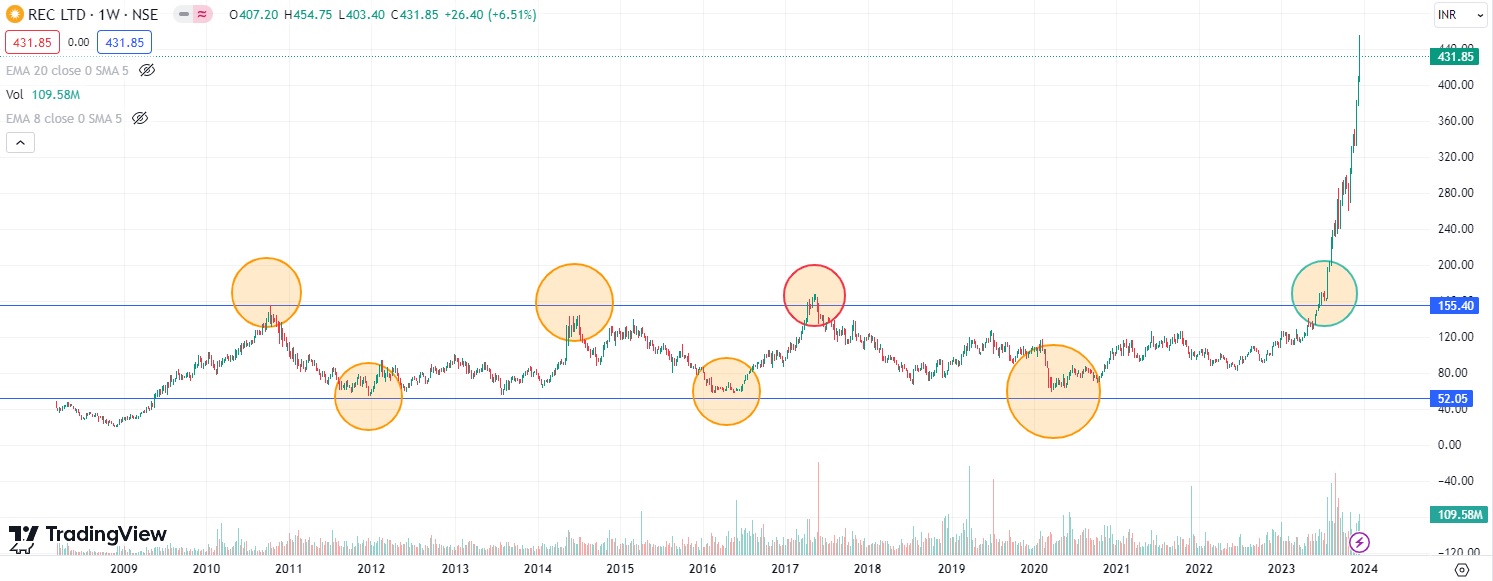
We will understand, what range is and how to play breakout trades. In this context, range is when a share or a security is trading between two levels.
In our example, REC LTD was trading between 155 on the higher side to 52 on the lower side for 13 years. Now, our game is not to buy or sell inside the range but to wait for a breakout especially on the higher side.
You can see how the range breakout was rewarding share has almost tripled in a matter of 6-7 months. Now, to master this trading there are certain rules you should keep in mind before entering a range breakout trade.
Rules for trading range breakouts-
1. Always select a higher time frame, preferably weekly time frame because longer the time of range, greater is the target you will get.
2. Do not buy every candle above the range, mark the high of the candle giving breakout and then enter the trade only if another candle closes above that high.
3. For risk management, use technical indicators on daily time frame, you can use exponential moving average 8 and 20.
Do not keep SL as per weekly time frame. In the example, we can see a red circle which shows a clear fakeout and also that it did not confer with our second rule. The green circle marks the real range breakout.
Take a screen shot to refer to these rules anytime you want.
Risk Management with lower time frame.
Before we understood weekly range breakouts, today we will understand how to manage risk and take the trend for this weekly trade.
For this we will use a technical indicator Exponential Moving Average (EMA). 2 EMA we will using are 8 and 20 on daily time frame.
Now, buying signal is when 8 EMA starts trading above 20 EMA and selling signal is when 8 EMA starts trading below 20.
Let’s understand this with our Rec Ltd Example. In the chart below, 8 EMA is marked with green line and 20 EMA is marked with red line.
The blue line below is the line above which breakout happened in weekly. You can see the green Line has stayed above red line since the breakout and this is how we can take the entire trend and we Square off once green starts trading below.
This is the easiest way of managing your risk in a weekly time frame trade.

Join Free Telegram Group now- https://t.me/equitywise